In Go, creating goroutines is straightforward, but improper usage may result in a large number of goroutines unable to terminate, leading to resource leakage and memory leaks over time. The key to avoiding goroutine leaks is to manage the lifecycle of goroutines properly. By exporting runtime metrics and utilizing pprof, one can detect and resolve goroutine leakage issues.
This post will go through one real case encountered by the author. The author maintains a service that connects to a target machine via SSH and executes commands. This is an internal service that is usually not closely monitored when everything is running smoothly. About 4 months ago, during the last update, a task counter was added and exported to Prometheus for monitoring. Recently, it was noticed that this counter has been steadily increasing.
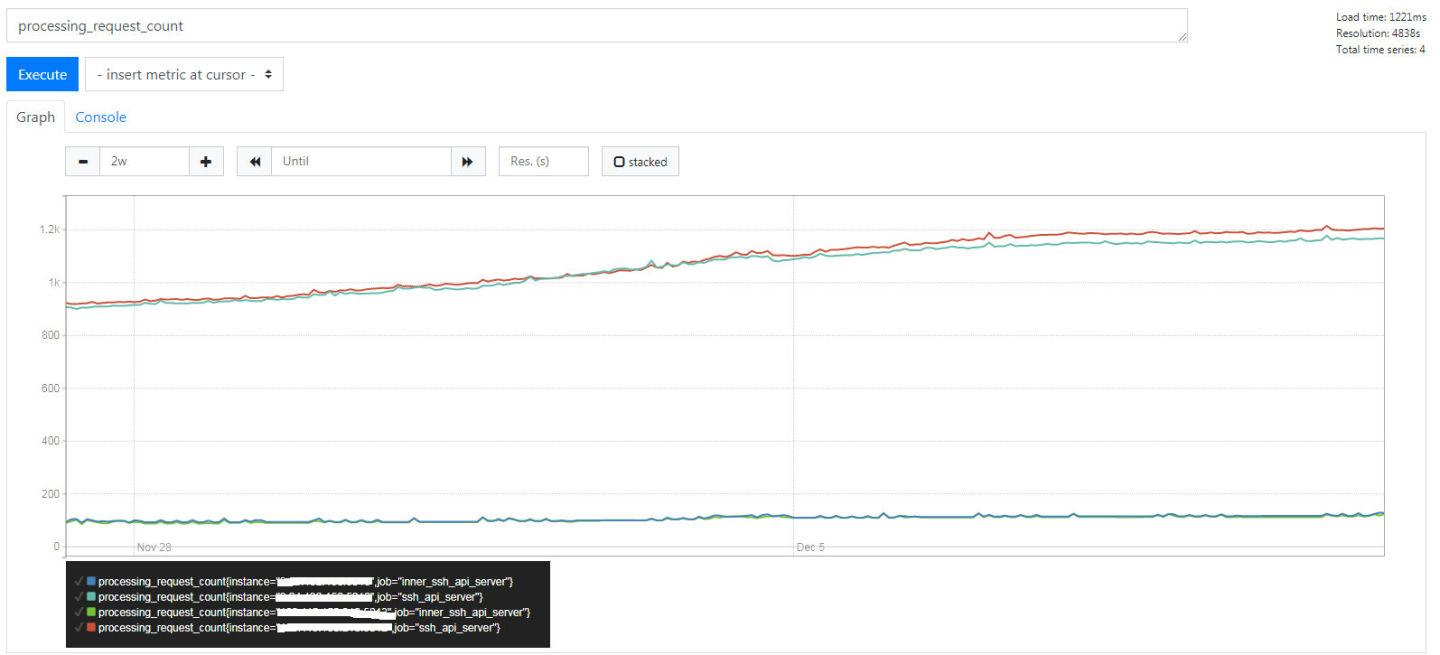
The initial reaction was positive – great! The number of calls is steadily growing! But something didn't seem right – where are all these calls coming from for this internal service? So, the monitoring of goroutines (obtained from runtime.NumGoroutine()) was checked.
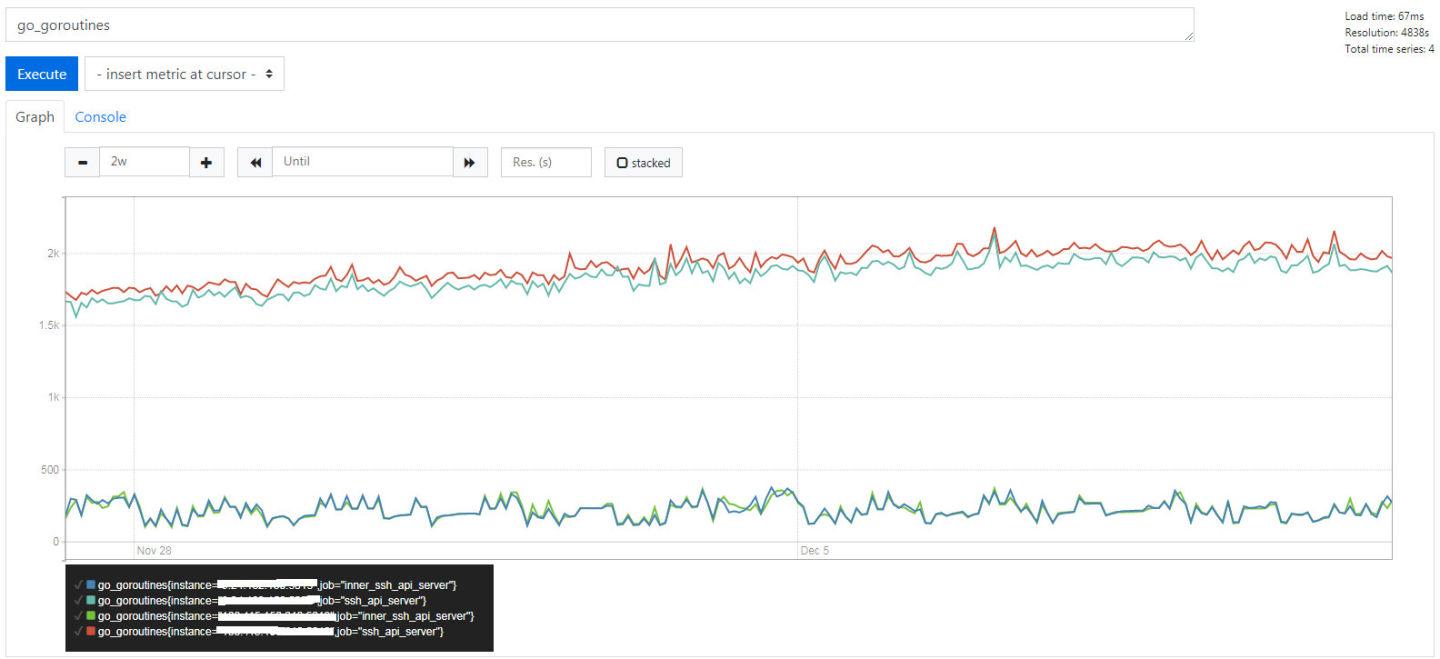
The number of goroutines was also steadily increasing. With the increase in requests over time, the number of goroutines also increased – all seemed fine. But then another thought came to mind – for an internal service like this, it's unlikely to have such a high volume of requests.
So, a closer look was taken at all the requests in the mm system's view:

It can be seen that the request volume is around 2000 every 5 minutes, averaging about 400 requests per minute. In the Prometheus monitoring chart above, each line represents an instance. In reality, there are 4 instances deployed. Therefore, the request volume for each individual instance (line) should be around 100/min, which matches the initial count of around 100/min when the service was first started. However, over time, it slowly leaks.
Goroutine Leak
Although it's assumed to be a leak, it's important to look at some detailed information. Previously, the net/http/pprof was enabled in the service, so the HTTP interface exposed by pprof was directly requested.
# Goroutine Summary
curl http://service:port/debug/pprof/goroutine?debug=1

# Goroutine Details
curl http://service:port/debug/pprof/goroutine?debug=2
Let's first take a look at the exported goroutine summary.
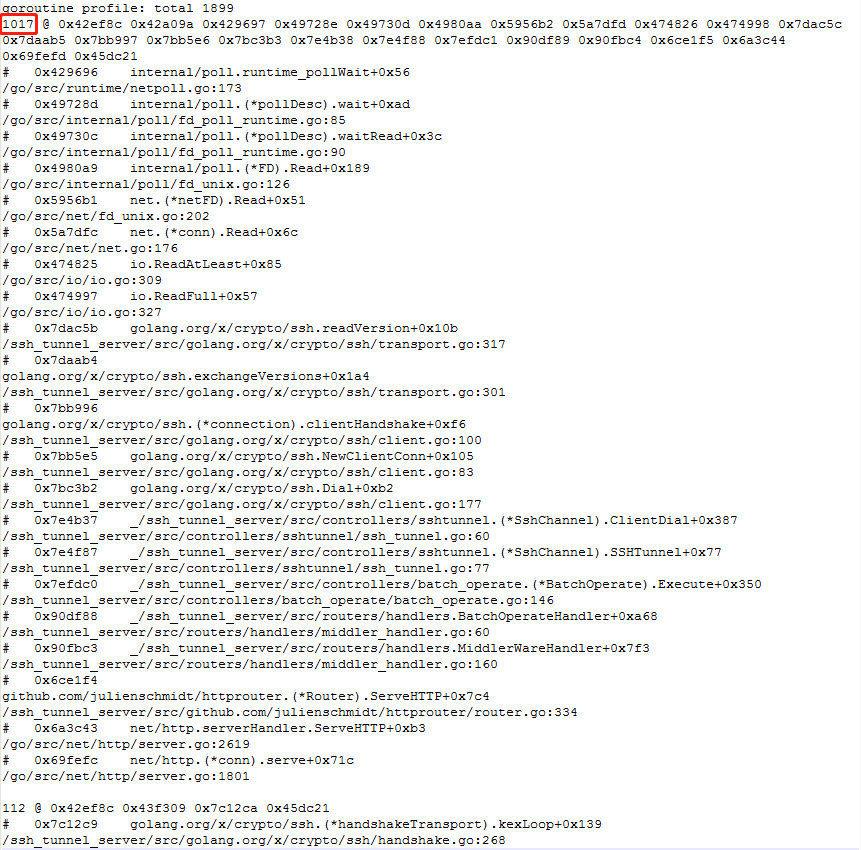
There are over 1000 goroutines in the same state, apparently waiting to read data. Now let's examine the exported goroutine details:
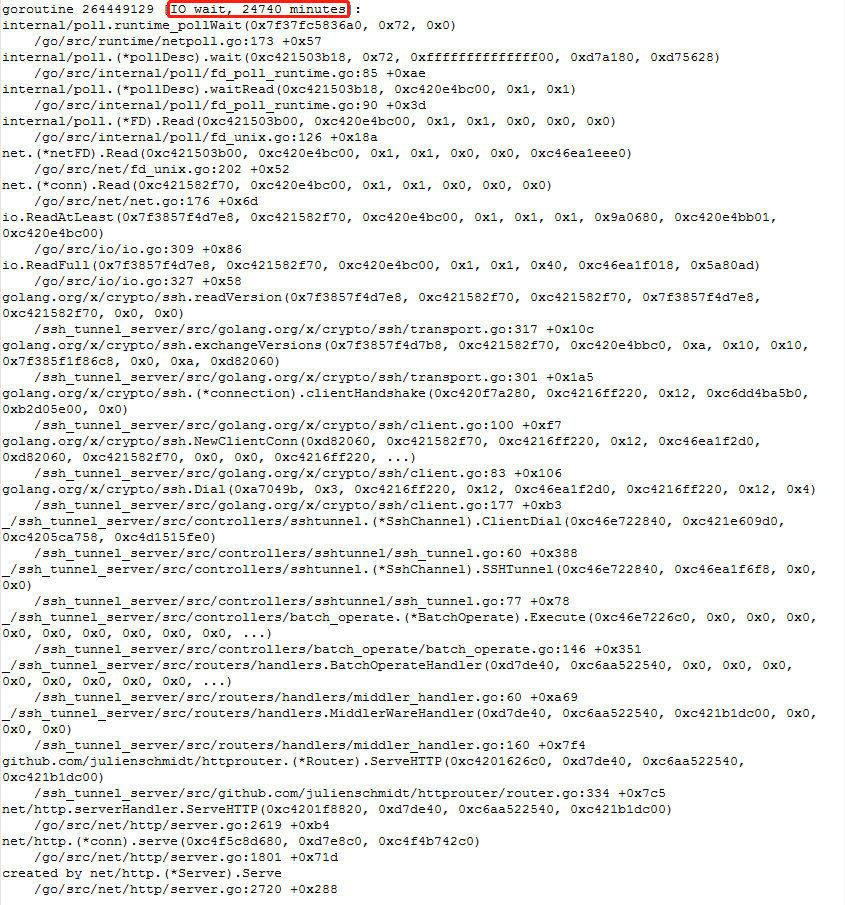
Upon inspection, some details revealed that some goroutines were blocked for over 20w minutes (4 months)...
It's undoubtedly a goroutine leak. Why is there a leak? The investigation must follow the exported goroutine information from pprof. The call stacks for over 1000 goroutines in the IO wait state were printed out. Based on these call stack contents, the corresponding code locations were identified, starting from ssh.Dial all the way to a point where io.ReadFull blocks.
This service uses the http://golang.org/x/crypto/ssh package for SSH connections. Let's first examine the places where ssh.Dial is called in this service:
clientConfig := &ssh.ClientConfig{
    ...
    Timeout: 3 * time.Second,
    ...
}
// connet to ssh
client, err := ssh.Dial("tcp", fmt.Sprintf("%s:%d", s.Host, 36000), clientConfig)
At first glance, everything seems fine. After all, a Timeout parameter is passed in, so it shouldn't block. Continuing to investigate, some issues were found. Jumping directly to the blocking point in the call stack (skipping libraries and runtime, as these are generally not problematic), it was found to be at the first step of the SSH handshake, exchanging SSH versions.
// Sends and receives a version line.  The versionLine string should
// be US ASCII, start with "SSH-2.0-", and should not include a
// newline. exchangeVersions returns the other side's version line.
func exchangeVersions(rw io.ReadWriter, versionLine []byte) (them []byte, err error) {
    ...
    if _, err = rw.Write(append(versionLine, '\r', '\n')); err != nil {
        return
    }

    them, err = readVersion(rw)
    return them, err
}

// maxVersionStringBytes is the maximum number of bytes that we'll
// accept as a version string. RFC 4253 section 4.2 limits this at 255
// chars
const maxVersionStringBytes = 255

// Read version string as specified by RFC 4253, section 4.2.
func readVersion(r io.Reader) ([]byte, error) {
    versionString := make([]byte, 0, 64)
    var ok bool
    var buf [1]byte

    for length := 0; length < maxVersionStringBytes; length++ {
        _, err := io.ReadFull(r, buf[:]) // blocked here
        if err != nil {
            return nil, err
        }
        ...
    }

    ...
    return versionString, nil
}
The logic is to send its version information to the other end and then wait for the response. However, no response is received. But why is there no response? Why isn't there a timeout? Initially, upon encountering this, I was puzzled. All I could think was that since these are all blocked waiting for a response from the other end, there must be corresponding connections. Let me first see if there are any issues with the connections on the machine.
TCP half-open
Ran the netstat command on the machine to check the number of connections.
# netstat -anp|grep :36000|awk '{print $6}'|sort|uniq -c
 2110 ESTABLISHED
      1 LISTEN
     41 TIME_WAIT
There were a large number of processes in the ESTABLISHED state, and the quantity roughly matched the number of goroutines. Let's focus on these connections first and inspect one or two of them.
Upon further investigation, it was found that some connections had 6 connections locally:
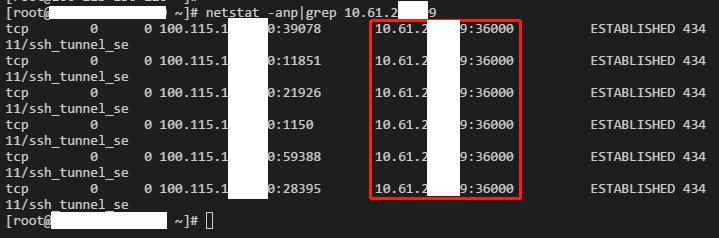
However, there's no response from the other end(the connection shown in the graph is my ssh connection to the target machine):
A quick Google search revealed that this situation falls under the TCP half-open state. This occurs when the other end terminates unexpectedly or due to other network connectivity issues, and if the connection doesn't enable KeepAlive, one end cannot detect this situation, leading to the continued display of ESTABLISHED connections on one side, while on the other side, the connection is lost when the machine is rebooted. Now, I need to confirm if KeepAlive is really disabled:
# ss -aeon|grep :36000|grep -v time|wc -l
2110
None of them are enabled... The number of connections without KeepAlive here matches the number of connections in the ESTABLISHED state shown by netstat above. Actually, there might be some new requests coming in between running these two commands, so these two numbers might not match completely, but mostly, KeepAlive is not enabled. That's all I need to know for now.
Let's take a look at the logic of ssh.Dial. It uses net.DialTimeout to establish connections, and the leaking version in the production environment is compiled with go1.9.2. In this version, the KeepAlive of the net.Conn structure returned by net.DialTimeout is disabled by default (go1.9.2/net/client.go).
The http://golang.org/x/crypto/ssh package does not explicitly enable KeepAlive when calling net.DialTimeout. It relies entirely on the default behavior of the current go version. In the latest version of go, KeepAlive is enabled by default when establishing TCP connections. So, I migrated the code to latest go and recompiled it, thinking that would solve the problem.
SSH Handshake Hang
Actually, it didn't. After running for a while, checking the goroutine situation with pprof, there were still many goroutines in the IO wait state, and looking at the call stack, it was still the same(exchanging version information during SSH handshake). Let's take a look at the connection status on the machine:
# netstat -anp|grep :36000|awk '{print $6}'|sort|uniq -c
81 ESTABLISHED
1 LISTEN
1 SYN_SENT
23 TIME_WAIT
# ss -aeon|grep :36000|grep time|wc -l
110
# ss -aeon|grep :36000|grep -v time|wc -l
1
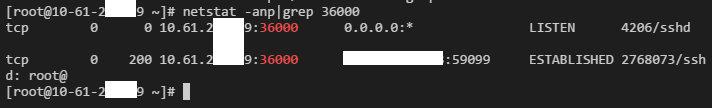
# ss -aeon|grep :36000|grep -v time
LISTEN 0 128 100.107.1x.x6:36000 *:* ino:2508898466 sk:ffff880a7627ce00The connection without KeepAlive is the sshd listening on port 36000 on this machine, and the rest have KeepAlive enabled, so there's no problem there. It indicates that these blocked connections shouldn't be due to TCP half-open causing blocking. Let's pick one IP and take a closer look.
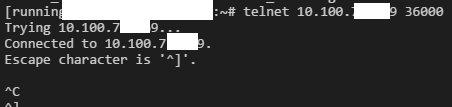
I can connect via telnet, but cannot disconnect. This indicates that the TCP connection can be established, but the other end doesn't respond for some unknown reason. Let's check how long this IP's connection has been alive.
# netstat -atnp|grep 10.100.7x.x9
tcp        0      0 100.107.1x.x6:8851        10.100.7x.x9:36000         ESTABLISHED 33027/ssh_tunnel_se
# lsof -p 33027|grep 10.100.7x.x9
ssh_tunne 33027  mqq   16u  IPv4 3069826111      0t0        TCP 100-107-138-166:8504->10.100.71.169:36000 (ESTABLISHED)
# ls -l /proc/33027/fd/16
lrwx------ 1 mqq mqq 64 Dec 23 15:44 /proc/33027/fd/16 -> socket:[3069826111]
The command was executed at 17:25 on the 24th, and it's been blocked for more than a day. So, the problem here is the lack of timeout control at the application layer. Going back to review the logic of ssh.Dial, the Timeout parameter is not used as a timeout control parameter during the SSH handshake. IO waiting on net.Conn is implemented using non-blocking epoll_pwait under Linux. Goroutines entering waiting will be suspended until an event arrives, and timeouts are handled by setting a timer to wake up the goroutine. The exposed interface is the SetDeadline method of net.Conn. Therefore, I rewrote the logic of ssh.Dial to add a timeout to the SSH handshake phase:
// DialTimeout starts a client connection to the given SSH server. Differ from
// ssh.Dial function, this function will be timeout when doing SSH handshake.
// total timeout = ( 1 + timeFactor ) * config.Timeout
// refs: https://github.com/cybozu-go/cke/pull/81/files
func DialTimeout(network, addr string, config *ssh.ClientConfig) (*ssh.Client, error) {
    conn, err := net.DialTimeout(network, addr, config.Timeout)
    if err != nil {
        return nil, err
    }

    // set timeout for connection
    timeFactor := time.Duration(3)
    err = conn.SetDeadline(time.Now().Add(config.Timeout * timeFactor))
    if err != nil {
        conn.Close()
        return nil, err
    }

    // do SSH handshake
    c, chans, reqs, err := ssh.NewClientConn(conn, addr, config)
    if err != nil {
        return nil, err
    }

    // cancel connection read/write timeout
    err = conn.SetDeadline(time.Time{})
    if err != nil {
        conn.Close()
        return nil, err
    }
    return ssh.NewClient(c, chans, reqs), nil
}
After replacing ssh.Dial with this function, compiling and deploying it, I checked the connection status, and everything returned to normal (back to how a small service should behave).
# netstat -anp|grep :36000|awk '{print $6}'|sort|uniq -c
      3 ESTABLISHED
      1 LISTEN
     86 TIME_WAIT
At this point, it becomes apparent that the problem addressed in this article is how to promptly close connections if abnormalities occur on the other end, rather than resolving the abnormalities themselves. After all, if SSH is malfunctioning, who can investigate the issue further? Given the vast number of servers in the production environment, each with its own operational characteristics, encountering abnormalities is inevitable. It's not practical to address them individually.
Conclusion
In Go, creating goroutines is straightforward, but improper usage can lead to a large number of goroutines unable to terminate, causing resources to remain unreleased and resulting in memory leaks.
The key to avoiding goroutine leaks is to manage the lifecycle of goroutines properly. By exporting runtime metrics using prometheus/client_golang and utilizing net/http/pprof, one can identify and resolve goroutine leak issues.
Reference: https://www.toutiao.com/article/6865126223844999691/
